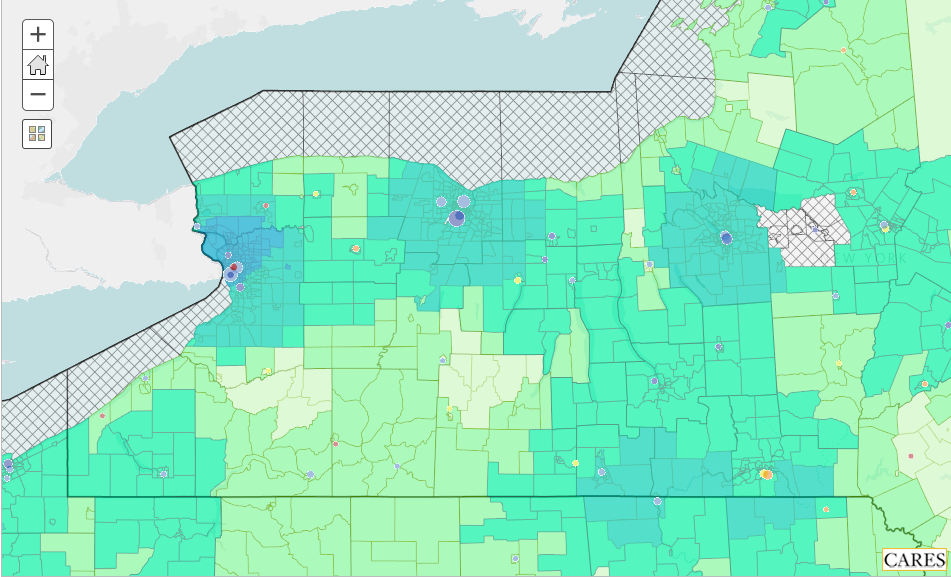
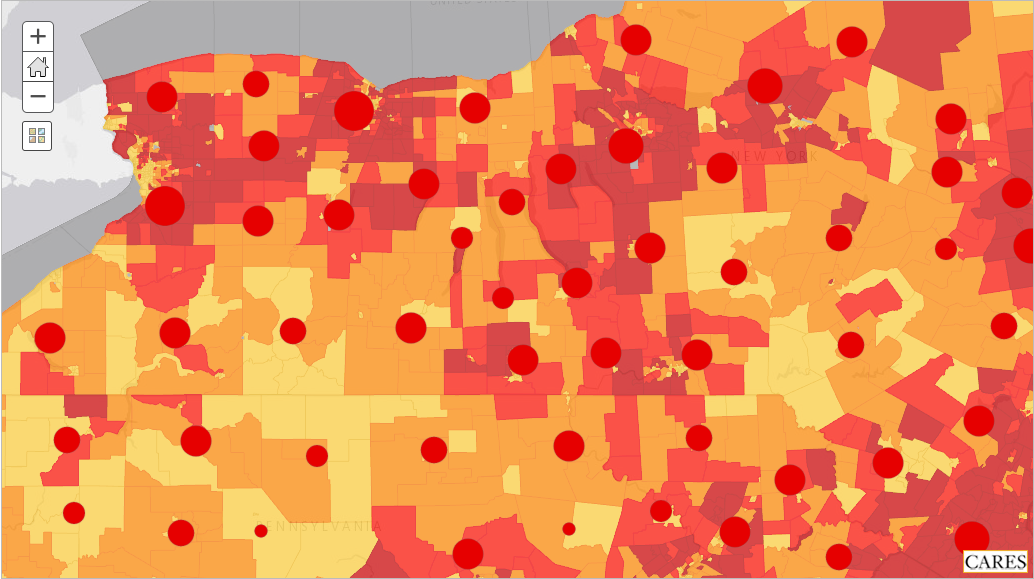
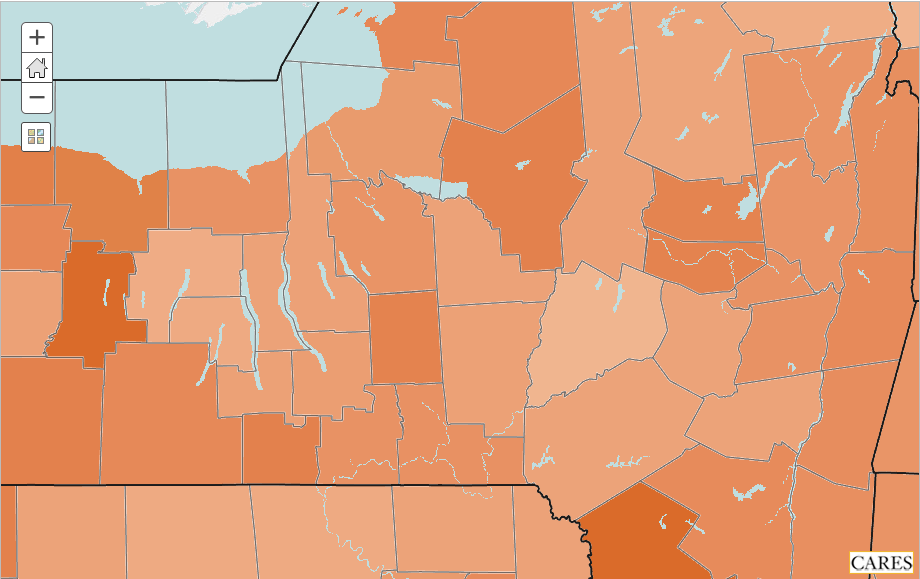
Skip to Main Content
New York Community Action Association
  • Community Needs Assessment
    • Map Room
    • Data & Map Library
    • What’s New
  • Poverty Report
  • Resource Guide
  • Support
    • Community Needs Assessment Support
    • Map Room Support
  • Log In
  • Community Needs Assessment
    • Map Room
    • Data & Map Library
    • What’s New
  • Poverty Report
  • Resource Guide
  • Support
    • Community Needs Assessment Support
    • Map Room Support
  • Log In

COVID-19 Dashboard

Map: Confirmed Cases & ICU Beds

COVID-19 Map featuring up-to-date confirmed cases of COVID-19 by County from the John Hopkins Institute, as well as Hospital locations, ICU Beds within 20 Miles by census tract, and ICU Bed Utilization Rate per 100,000 population.

COVID-19 Interactive County Report

This report provides a selected set of indicators related to the COVID-19 pandemic, including case counts and fatalities, health care infrastructure data, and social/economic vulnerabilities. Maps and data are available for individual counties and groups of counties.

Map: Economic Impact

COVID-19 Starter Map featuring Economic information including Median Household Income, Population Below the Poverty Level, Gross Domestic Product, as well as confirmed COVID-19 cases from the John Hopkins University.

Map: Health Factors

COVID-19 Starter Map featuring health information including County medicare beneficiary rates of Asthma, COPD, Cardiovascular Disease, Diabetes, High Blood Pressure, High Cholesterol, and confirmed COVID-19 Cases and Deaths from the John Hopkins University..

Map: Demographic Vulnerability

COVID-19 Map featuring Demographic information including Disabled Population, Median Age, Total Households, Total Population as well as confirmed COVID-19 Cases and Deaths from the John Hopkins University.

Powered by:

Questions?

Reach out to kleinsorgej@missouri.edu

© 2025 Powered by CARES